6 Ways to Improve Your Content Analysis

Two weeks ago, we wrote a blog post on the importance of performing content audits. Whether you are planning for a future website redesign or simply doing some spring-cleaning (or should I say winter-cleaning), a content audit serves as an opportunity for you to step back objectively and perform a high level critique of your content. We recommended some tools in our last blog post, but what we didn't specify is what you should do with those tools. So in today's blog post, we will explain some of the more common reports we utilize within Google Analytics to audit our client's content. Hopefully, it's useful to you.
All Pages Report

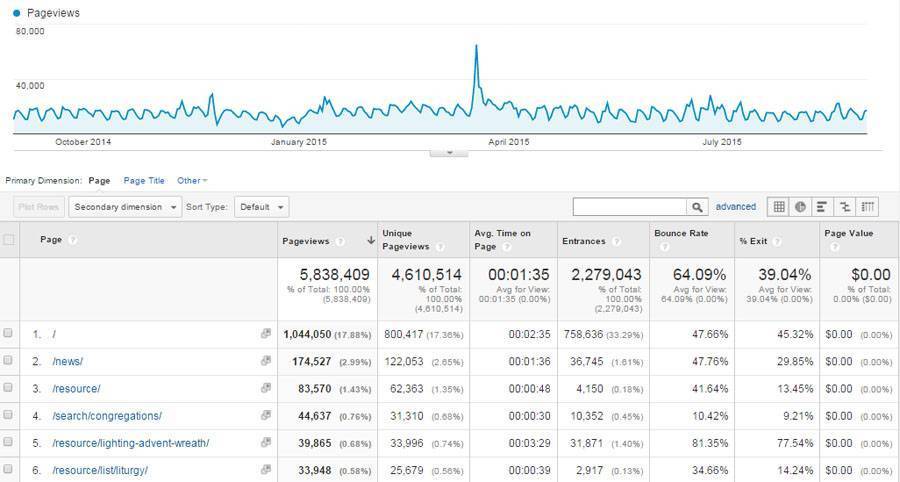
The All Pages Report is the Gold Standard for content analysis. At a quick glance, online marketers can assess the performance of every page of your website using metrics such as total pageviews, average time on page and bounce rate. When auditing websites for our clients, we typically use this report to gain a better understanding of the most popular and least popular content. Often times, clients expectations of what content is important does not match reality. You can also use the advanced search filter of Google Analytics to narrow your focus to specific pages that may be hidden among hundreds or thousands of pages. Common questions that this report can help answer include:
- Which pages are responsible for the most pageviews on your website?
- What pages receive little to no traffic?
- How many unique pageviews did a webpage receive?
- What is the percentage of overall pageviews that a specific webpage received?
- Is the traffic to a page trending up or down?
Content Drilldown

The Content Drilldown Report aggregates information based on the structure of your URLs. It also serves as an alternative to the Behavior Flow Report, showing paths that visitors use to navigate through your site. This feature has been particularly useful in the past when performing client audits where websites share common naming conventions. In other words, its extremely useful in assessing the value of a blog in a situation where all blog posts on the website have /blog in their URL path, but isn't as handy when blog posts do not use a common naming convention. Questions that this report can help you answer include:
- Which page paths are responsible for the most pageviews on your website?
- Which page paths receive little to no traffic?
- Which secondary page paths are most likely to be visited from a selected primary page path?
- How many unique pageviews did a page path receive?
- What is the percentage of overall pageviews that a specific page path received?
- Is the traffic to a page path trending up or down?
Landing Pages

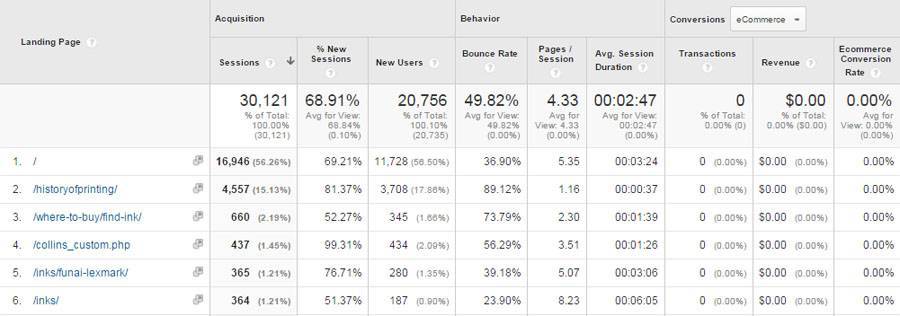
Content can be valuable for different reasons. Landing pages are extremely valuable because they serve as the entrance points into your website. Eliminating the wrong landing pages can be detrimental to your traffic. Understanding the sources of traffic that are responsible for your traffic is also extremely useful in assessing the performance of your marketing efforts. Common questions we answer with the Landing Page Report include:
- Which pages serve as the most popular landing pages?
- Which landing pages are not working?
- What sources of traffic contributed most to a landing page?
- Are sessions to a landing page trending up or down?
Conversion Rates
What is the purpose of people visiting your website? In most cases, you want them to do something; fill out a form, purchase a product, or subscribe to a newsletter. Just as we would not want to delete our best performing landing pages, we also wouldn't want to get rid of those pages with the highest conversion rates. If you are planning a redesign, you want to avoid hiding or burying these pages in the new information architecture.
Exit Pages

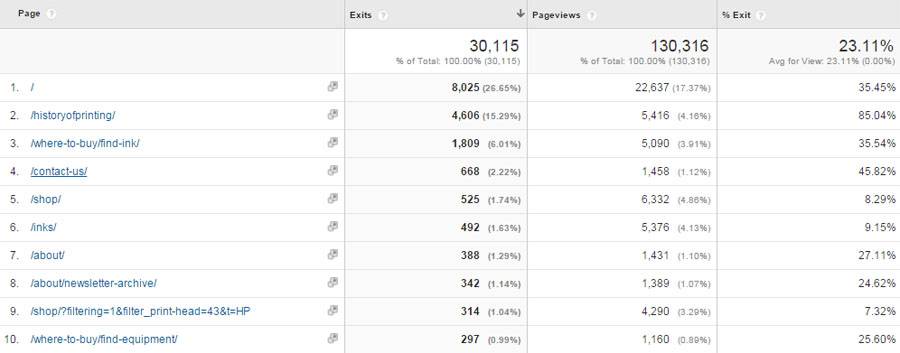
Where is my website failing? This is the primary question that the Exit Page Report can help you answer. The Exit Page Report identifies the last page on your website that visitors viewed before leaving. Under the best circumstances, the result would be visitors are leaving from the Thank You page after a successful conversion. Under the worst circumstance, they are leaving on the checkout page or your home page.
- What pages were users most likely to leave the website from?
- Are exit rates to a page trending up or down?
Peaks/Valleys

In every single one of these reports, Google Analytics charts the performance over a time duration you specify. Time is an important consideration when doing content analyses as it is likely that content has a seasonal or temporal component. Peaks and valleys in any of the above reports serve as important dates to investigate further. What caused the change in traffic? Where did the traffic originate?
Content analysis is a vital skill for any online marketer to acquire. This blog is in no way comprehensive, but we hopes its sets you down the right path to becoming a better auditor.


